
“How do you know if your investment portfolio is doing well?”
I usually get a range of responses to this question. They start from “ummmmm (which means I have no idea)” to “when it delivers the best returns“. The latter also means “I have no idea” but with an attempt to sound smart.
Very few investors are aware of what makes their investment portfolio worthwhile. Let alone that, they don’t even know what is their portfolio return. They know their FD return, PPF return, NSC return, but portfolio return?
You would realise that the ‘portfolio return’ is one of the key numbers that tells you if your investment portfolio is really working for you or not.
Today, let’s set aside all our excuses and do an acid test on your investment portfolio.
What’s the Acid Test for your investment portfolio?
The Acid Test is simple. It relies on two common numbers. You may know about them but probably haven’t looked at them together. They are:
- Investment Portfolio Return (just mentioned it above)
- Rate of Inflation
When I mention Portfolio Return, I mean the return from the entire portfolio and not the return from any one investment. The Rate of Inflation, of course, is the rate at which prices increase.
Now, long-term wealth building depends on your investment portfolio growing not only in nominal terms but also in real terms. Just hang on there!
Let’s get this ‘nominal and real‘ out of the way. When you say that your Bank Fixed Deposit gives you 10% interest per year, that 10% is a nominal return. Now you also know that prices increase every year, courtesy inflation. Suppose that the inflation rate is at 12% per year.
The fun starts now. You could be getting a 10% on your fixed deposit but with the inflation at 12%, your ‘real return‘ is a negative 2% (10%-12%). Essentially, you are 2% out-of-pocket.
And that is the ACID TEST of your investment portfolio.
Is your investment portfolio return beating the inflation rate or not?
Because if it is not, then you are effectively losing the value of money. You will have to work much more hard to compensate for this loss of value.
Actually, why would you make your money underwork? One big reason for creating an investment portfolio is to build enough wealth to become financially independent. The money should work for you, not you for the money.
Makes sense? OK. Let’s run the acid test now.
Running the Acid Test on your investment portfolio – A Step-by-Step process
Let’s get down to work immediately. To begin with, download ‘Acid Test Investment portfolio‘ excel workbook.
When you open the workbook, you will see a table. It looks like this.
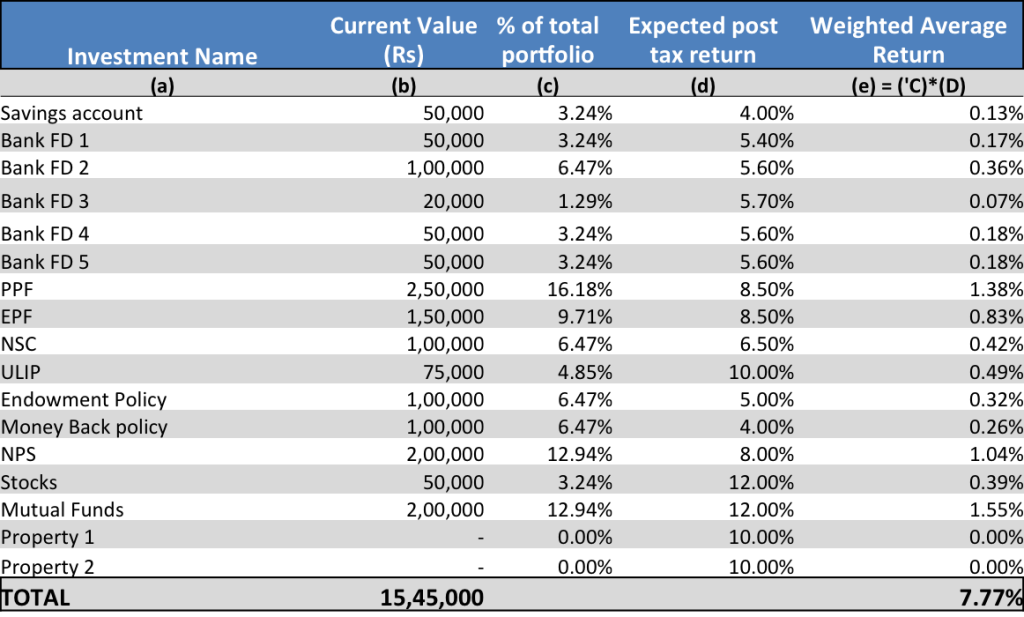
You have to use this sheet to list all the investments in your portfolio.
So, let’s first get the entire portfolio in place.
Open the excel sheet and follow these simple steps:
- Enter all your investments under the column (a) of ‘Investment‘. Feel free to insert more rows if you want to. You can also change the names in each row.
- In the next column (b), enter the ‘Current Value‘ of each investment.
- The third column (c) will automatically calculate your ‘% allocation’ for the investments in the total portfolio.
- In column (d), I have already mentioned ‘expected post-tax returns‘. However, that is indicative. Feel free to add/edit the numbers for each of your investments. Remember this number is post-tax. So, if you have a Bank Fixed Deposit at 9% interest per year and you are in the 30% tax bracket, then your effective interest rate is 5.7% [9% (minus) 30% tax on it].
- The last column (e) automatically calculates your ‘weighted return‘ for each investment in the portfolio.
Once you have completed the data input, you will see another number in the table – ‘total weighted average return‘ at the bottom of column (e). This is a very important number. It is calculated automatically.
Next comes the interesting part.
What is the inflation rate you think that applies to you?
You will see this row below the table where you have to enter the ‘rate of inflation’.
![]()
Don’t go by the government figures like WPI or CPI. The inflation that actually affects you is a very different number.
In case you can’t figure that out, I recommend you work with a rate of 10%. If you have to change it, change it to a higher number, say 12%, not a lesser one. The 10% rate of inflation works for me at least – specially with annual increases in rent and household expenses.
As soon as you input this number, it’s time to run the ACID TEST.
Did your investment portfolio PASS the ACID TEST?
As I mentioned before, the ACID TEST is whether your investment portfolio return is beating inflation or not?
On the right side of the table, you will see the result as PASS, FAIL or NEUTRAL.
What do the words mean?
- If your portfolio return is more than inflation rate, it’s a PASS.
- If your portfolio return is less than inflation rate, it’s a FAIL.
- If your portfolio return is equal to inflation rate, the result is NEUTRAL.
In the excel file that you downloaded, you will see that the portfolio has FAILED the ACID TEST.
I am not quite sure if you have ever done this exercise before. If not, today is the day when you should do it. Right?
Download the excel file below (if you haven’t till now) and get started.
Click here to download the excel file for ‘Acid Test Investment portfolio’.
What does the ACID TEST tell you?
While the PASS result is desirable – how much more should the portfolio return be than the inflation rate?
If you get a different result than PASS, what should you do to set your portfolio right?
These are the questions I want to leave you with.
Let’s take the discussion and learning forward. Share your result, your answers and your action plan now in the comments.
Between you and me: Your participation matters and you can add to everyone’s learning. It empowers you too. So do not hesitate. Make your contribution in the comments. I keenly look forward.
Hi Vipin,
What is the basis of property return as 10%.
Also If a person is having a NRE status and he doesn’t have to pay taxes on fixed deposit.Then whats wrong if he has higher portion of asset allocation in FD, becasue his effective return will be more than what bank offered as 8% or 9%, due to compunding.
Thanks
Ashish
Hi Ashish
Property return of 10% – a wild imagination. One can be more conservative on this.
NRE FDs without tax. Yes, that’s right. And there is no harm to keep debt portion of the portfolio parked in there as much as you want, as long as it helps you fulfil your goals.
Thanks
Hi Vipin,
Is there any way that I can do the acid test for MF portfolio only.
I am 27 and investing in MF since I was 23 , Now with the market condition I am seeing my profits eroding. I have some basic ques:
1) At what period one should revise MF portfolio?
2)If in 1 year some of MF in portfolio are doing bad what should I do(Sell it or stop SIP or do nothing & keep investing)?
3) It is easy to say switch or sell bad performer but in reality it attracts exit loads and tax implications. So What approach to follow?
Waiting for your reply.
Thanks
Rakesh
Hi Rakesh
Thanks for the comment. You should review your MF portfolio once in a year. however, you might want to change a bad fund only when something has terribly gone wrong with it. Short term underperformance is not the biggest reason to let a fund go.
If your primary reasons of selecting a fund have been right, then you should let your investments go in.
Exit loads and capital gains, currently, occur only when you sell something in less than 1 year. As i suggested, you have to wait for at least an year and ideally a couple of years.
You may also want to read this: https://vipinkhandelwal.com/profit-booking-in-mutual-funds/
hope this helps.
Why doesn’t CPI accurately measure inflation? What are some things that we buy commonly that are excluded in the CPI calculation and that inflate at a high rate? Thanks.
Kartick, CPI is a general use figure constituting certain items of daily use by a person. Based on an individual’s lifestyle the inflation rate may differ.
CPI is about day to day life of a resident Indian. What CPI measures for example for pulses and cereals is what is available in the kirana stores.
Now, if you choose to buy and eat organic food, the same numbers don’t for you. So, some sort of discretion is advisable.
You may like to read this article: http://www.livemint.com/Money/tdiRmQuAG2MV0MPzImH1LP/DYK-The-components-of-WPI-and-CPI-differ.html
and also visit this link: https://data.gov.in/catalog/all-india-consumer-price-index-ruralurban
CPI represents a basket of goods which an ‘average’ Indian’s basket of purchase of goods would constitute. It is arrived at after taking into account ‘price data’ and weightage data’ as per the model CPI formula comprising of basket of goods as mentioned above. CPI has been constituted – separately for Urban Consumers and separately for Rural Consumers because of changing pattern of consumption.
Normally it does not represent what we are actually facing in the form of ‘inflation’ or rising prices simply because of changed weightage in our basket of consumption and slight variation in prices as captured by government agencies and then, of course, time lag between price capture and compilation and presentation to the public.
Understood. Thanks, Vipin and Kamal.
Just one point regarding the ‘lag’ in compilation: won’t that get evened out over a longer term, like a decade? It won’t matter which of the intermediate years the inflation gets accounted to.
Yes, agreed. Normally the ‘lag’ remains the same over a longer period of time. What I was referring to is the difference in prices between what we see in the market and what is represented in CPI calculation.
Otherwise, for no one it actually matters. Even not for the Economists, RBI, Government, Statisticians, etc. Because as rightly pointed out by you, the ‘lag’ remains same over a longer period of time.
Seems like a great discussion going on in here.
I took the acid test and I failed 🙁
While I agree that for few areas (such as saving account, FDs, PPF, EPF), we know the exact return rate, mentioning return rate for stock or mutual funds is totally based on assumptions since they are unpredictable in nature.
Now, how we can judge something which is based on some assumptions? For sake, I could mention MF return rate as 30% and get the result as Pass or can mention it as 7% and get the result as Fail.
So at any given time period, it is totally on our return assumption, isn’t it? Don’t know, how this will help us to improve?
Please excuse me if my understanding on this topic is incorrect.
Umesh, you are correct and have asked a very important question. It is difficult to make an estimate of returns from market linked instruments like stocks or equity mutual funds.
The general rule that can be followed here is to take the GDP growth rate + the inflation rate and add the two to arrive at the rate of growth of stocks. The reasoning is that the individual stocks or companies’ growth is what gets reflected in the economic growth too, which in this case is the GDP. So, if the GDP average is about 7% just add the inflation to it and you will have a working number for you.
Hope this helps. Thanks for the comment. Vipin
Taking nominal growth rate of GDP as “your” portfolio’s return is complete misnomer and wrong. That can work ideally as only benchmark. If I take that as a ‘portfolio valuation and performance’ indicator, then, anybody’s (including my portfolio) portfolio would be in crores which is not the case. It has to be individual specific – as what “X” has earned out of his portfolio or his portfolio valuation. That’s the reason, I said that it can’t be applied to period based investment which include stocks (price uncertainty) and property also (period based investment – you can only get a ball park figure on any date – your actual valuation of your property is known when you actually sell it).
Point taken Kamal. Let’s see what Umesh has to say.
Well, I think it is relevant because in the file Vipin is talking about stocks and I assumed he is talking about the portfolio of stocks an individual owns. When you are owning a portfolio of stocks the idea is that on an overall basis it should be able to deliver higher returns than Real GDP+Inflation, otherwise one is better of just holding an index fund which will tend to give returns equal to GDP + Inflation. For instance India’s long-term GDP I think has been around 5-6% and inflation has been around 8-10% which means Nominal GDP has grown by 13 to 16% and the long-term return of either Nifty of Sensex is in the range of 14-15%.
Though I agree that it is not easy to benchmark an individual stock against anything , but over the long term any riskier or uncertain investment or portfolio of riskier or uncertain investment should deliver real returns for the investor in order to compensate for the risk taken.
Thanks
Ashish
BTW, now that you know that you failed the test. What are you going to do to about it?
I am clueless (unless you provide me some pointers) about what I should do for the failed test 🙁
BTW, I did not understand the GDP + Inflation combo totally that you guys discussed, one thing surely I learn is, earning money is hard, preserving money is harder, and growing money is hardest 🙂
A lesson well learnt, Umesh.
As for the test, I am not sure how have you arrived at your result. Can you share you sheet with me on email? There could be some pointers I could help with.
Thanks
Sure!
Looks good for a starter. For actual use in reality with lots of period based investments, probably it needs to include some more working to make it more right and relevant. Decision on inflation can be tricky for an ordinary person, and, therefore, one can take, say 2% plus CPI or 4% plus CPI (depending upon the lifestyle of the person).
Thanks Kamal. Your points are valid. The simple idea is to help build awareness about the portfolio. I have met several people who don’t even know this, sitting completely on Fixed Deposits, or worse, all money lying in bank savings account. Regards