Most probably, you now know that there are over 300 equity mutual fund schemes. Some of them have managed to attract the largest investments from you. I call them the popular funds.
Typically, a scheme attracting more assets/investments due to its recent performance ( last 1 year, 3 year or 5 year). That is when the ranking and rating agencies put them up on the pedestal with high star ratings or No. 1 ranks.
Not to forget that even the fund begins chest thumping and lets the world know the champion it is. As a result, investors take notice and pump in more money.
I remember a conversation, from years ago, with a friend, who worked with a Mutual Fund. He mentioned that when the markets are rising the funds don’t need to do anything and when the markets go down, they can’t do anything.
I laughed out when I heard that.
Well, what I realise years later is that the true test of the fund is not as much about how it does in rising markets but how it does when the markets are on a slide.
Interestingly, no fund talks about its worst performance. Of course, it would also be foolish of it to do so!
The fund may not talk but you and I can.
I looked at some of the most popular funds and how they fared in their worst times. This is how I went about it.
I took some of the most popular equity funds, that is, having the largest assets under management or AUM. Equity funds are those that have at least 65% of their investments in Indian Stocks.
This is for 5 categories. The number in brackets is the number of funds taken in that category.
- Large cap funds (5)
- Flexi cap funds (5)
- Mid cap funds (5)
- Small cap funds (3)
- Hybrid – Equity funds (5)
Hybrid Equity funds have a stated objective to have a portion to invest in debt. Having said that, they invest at least 65% of their assets in stocks.
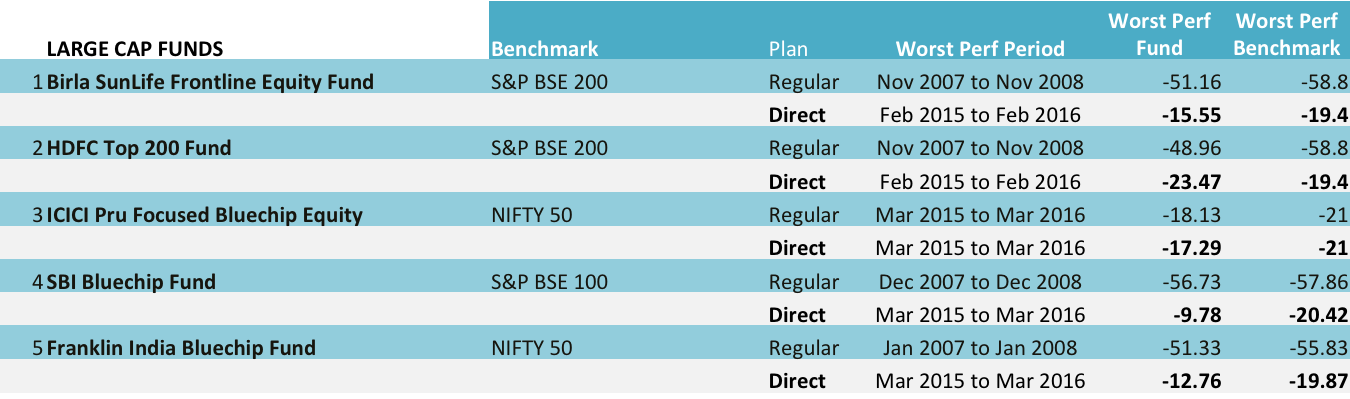
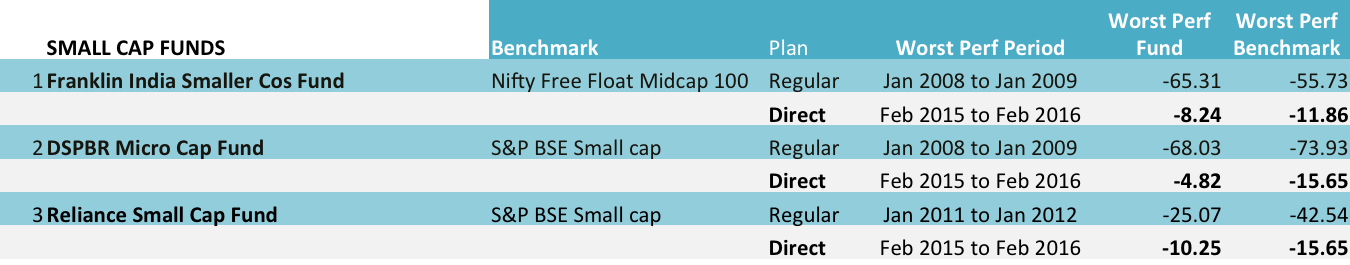
For each of these funds, I looked at the 1 year period in which they delivered their worst performance. This 1 year period is ANY 1 year period for the fund and not a fixed date range. Then I compared it with the change in the stated benchmark of the fund for the same period.
This data is for regular plans as well as direct plans.
All the data is sourced from Unovest and is as on Nov 5, 2016. The worst performance is a % and indicates the total fall in the value of the scheme for the period.
Here are the tables for you to see and make your own inferences.
Large Cap funds – worst performances
Flexi Cap funds – worst performances
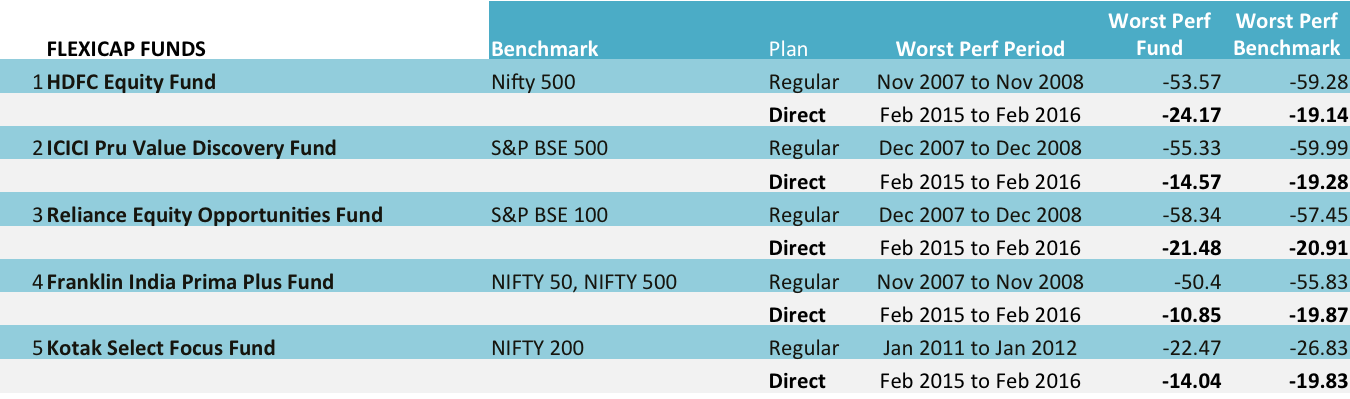
Please note: ICICI Pru Value Discovery has only recently become a flexi cap fund, it was a mid cap fund previously.
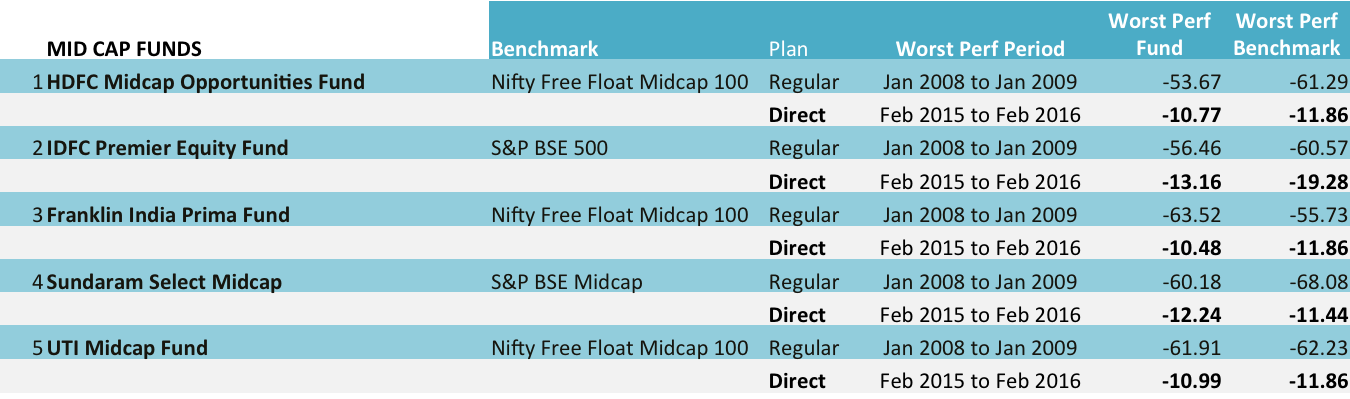
Mid Cap funds – worst performances
Small Cap funds – worst performances
Hybrid Equity funds – worst performances
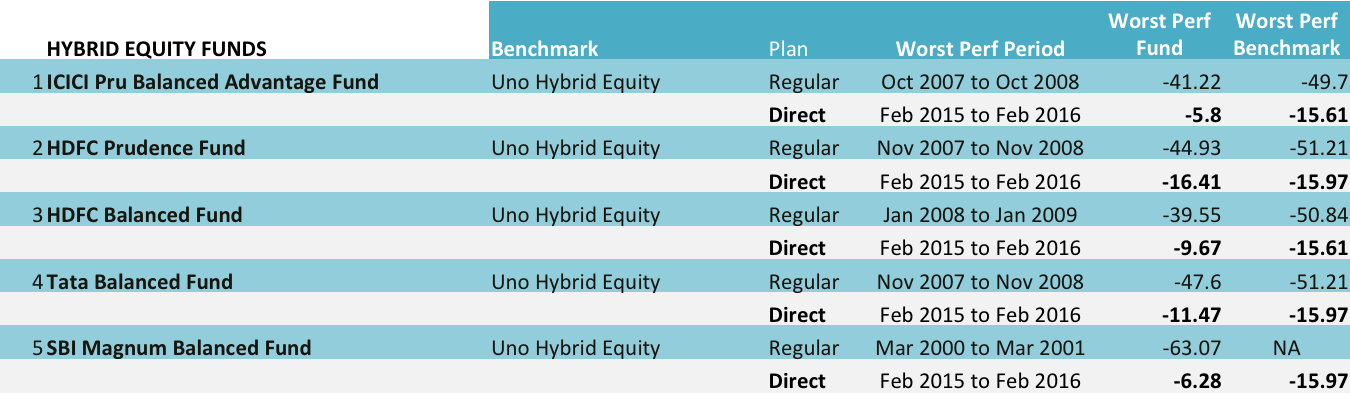
Uno Hybrid Equity is a custom benchmark index of Unovest and comprises of 65% of Nifty 500 and 35% of CCIL Bond Index. The CCIL Bond Index didn’t exist in March 2000-01 and hence the benchmark is shown as NA.
Please remember that the funds above are only the most popular ones with the highest AUM and not what you or I may prefer.
Also, the performance of direct plans is not as bad as regular plans because they have only been around for close to 4 years.
This exercise serves as a reminder that it is not always hunky dory with investing in stocks or equity mutual funds. They can fall and they can fall really bad.
Do you have the stomach for these worst performances?
Disclaimer: No portion of this post should be considered as investment advice or recommendations. Adequate efforts have been taken to ensure accuracy of data, but the same cannot be guaranteed.
Hi,
This is super important thing to understand. Let’s use Maths to help us understand this
Let’s say there are two funds A and B, both with NAV of 100, now markets crashes and A falls by 50% but B falls by 75%. Now the NAV is 50 for Fund A and 25 for fund B. Fund B has fallen 25% more than Fund A.
So what both of them fell one fell more – well look at this now – For Fund A to go back to NAV of Rs 100 it needs to gain 100% – If you think about it to recover loss of 50% Fund A has to gain back 100% – too bad. Look at Fund B, for it to gain back NAV of Rs 100 it need 400% returns – for a loss of 75% you need 400% to recover.
Losing 50% and 75% don’t seem that different than making 100% and 400% – but here we are. Therefore not loosing money or loosing less when others are loosing is the most under appreciated hallmark of great fund managers.
Thanks for adding this Ashish
Hello Vipin,
You did manage to answer the question, which was; how did the large funds perform (against the direct funds) during the same period. So those probably would not have been the worst case scenarios compared to the 2007-08 timeframe.
Regards
Sridhar
Thanks Sridhar.
Vipin,
Nice article, but I have a query. In the midcap category, HDFC, Franklin and UTI funds have the same benchmark and all three had their worst period between Jan 2008 and Jan 2009. How come the benchmark’s performance vary for the 3 funds sharing same benchmark and same time period??
Hello Vipin,
First, I would like to congratulate you on your blogs. They are very informative and easy to follow. I have just started reading them recently and I do enjoy them very much. Keep up the great information service and thank you!
Coming to the analysis of largest AUM funds and their worst performance. It would be even more informative if you had compared the largest with maybe the worst and best in that category along with a benchmark. We know 2007-8 was a disaster, so unless we compare them with the really worst/best and the benchmark, its difficult to tell if these funds really did badly. If the worst had dropped 70%, a 50% wouldn’t seem all that bad!
Secondly, you do point out that direct funds only started much later, so this really isn’t a comparison. May have been better to separate them in relation to time. Again, how did the largest AUM funds fare doing that same time period? From what I understand direct funds typically perform slightly better simply because they have lesser fees. So one can assume the large funds probably only did slighter worse?
Keep up the excellent reporting and I look forward to reading all of them !
Best regards
Sridhar
Dear Sridhar
Thanks for the kind words and the encouragement.
As for the post, this wasn’t meant to be a comparison but only an indicator of when then funds fall how much they can. In good times, an investor can throw all caution to the winds. This was supposed to be a reminder, that they should consider the other side too.
Having said that, what you mention for comparison is interesting. That is fodder for another post.
Next, I am afraid I did not understand your query about “how did largest AUM funds fare doing the same time period?” If you are referring to regular vs direct in the same time frame, you are right, the only difference would that be of the expense ratio and the resulting return. There is no difference in portfolios.
Thanks again